Flux Prometheus metrics
Flux has native support for Prometheus metrics to provide insights into the state of the Flux components. These can be used to set up monitoring for the Flux controllers. In addition, Flux Custom Resource metrics can also be collected leveraging tools like kube-state-metrics. This document provides information about Flux metrics that can be used to set up monitoring, with some examples.
The fluxcd/flux2-monitoring-example repository provides a ready-made example setup to get started with monitoring Flux. It is recommended to set up the monitoring example before continuing with this document to follow along. Before getting into the monitoring setup, the following sections will describe the kinds of metrics that can be collected for Flux.
Controller metrics
The default installation of Flux controllers export Prometheus metrics at
port 8080 in the standard /metrics path. These metrics are about the inner
workings of the controllers.
Flux resource reconciliation duration metrics:
gotk_reconcile_duration_seconds_bucket{kind, name, namespace, le}
gotk_reconcile_duration_seconds_sum{kind, name, namespace}
gotk_reconcile_duration_seconds_count{kind, name, namespace}
Cache event metrics:
gotk_cache_events_total{event_type, name, namespace}
Token cache metrics:
gotk_token_cache_events_total{event_type, kind, name, namespace, operation}
gotk_token_cache_requests_total{status}
gotk_token_cache_evictions_total
gotk_token_cached_items
Controller CPU and memory usage:
process_cpu_seconds_total{namespace, pod}
container_memory_working_set_bytes{namespace, pod}
Kubernetes API usage:
rest_client_requests_total{namespace, pod}
Controller runtime:
workqueue_longest_running_processor_seconds{name}
controller_runtime_reconcile_total{controller, result}
In addition, many other Go runtime and controller-runtime metrics are also exported.
Resource metrics
Metrics for the Flux custom resources can be used to monitor the deployment of workloads. Since the use case for these metrics may vary depending on the needs, it’s hard to decide which fields of the resources would be useful to the users. Hence, these metrics are not exported by the Flux controllers themselves but can be collected and exported by using other tools that can read the custom resource state from the kube-apiserver. One such tool is kube-state-metrics (KSM). KSM is also deployed as part of kube-prometheus-stack and is used to export the metrics of kubernetes core resources. It can be configured to also collect custom resource metrics. The monitoring setup in flux2-monitoring-example uses KSM to collect and export Flux custom resource metrics.
In the
example monitoring setup, the metric
gotk_resource_info provides information about the current state of Flux
resources.
gotk_resource_info{customresource_group, customresource_kind, customresource_version, exported_namespace, name, ready, suspended, ...}
customresource_groupis the API group of the resource, for examplesource.toolkit.fluxcd.iofor the Flux source API.customresource_kindis the kind of the resource, for example aGitRepositorysource.customresource_versionis the API version of the resource, for examplev1.exported_namespaceis the namespace of the resource.nameis the name of the resource.readyshows the readiness of the resource.suspendedshows if the resource’s reconciliation is suspended.
These are some of the common labels that are present in metrics for all the kinds of resources. In addition, there are a few resource kind specific labels. See the following table for a list of labels associated with specific resource kind.
| Resource Kind | Labels |
|---|---|
| Kustomization | revision, source_name |
| HelmRelease | revision, chart_name, chart_app_version, chart_source_name, chart_ref_name |
| GitRepository | revision, url |
| Bucket | revision, endpoint, bucket_name |
| HelmRepository | revision, url |
| HelmChart | revision, chart_name, chart_version |
| OCIRepository | revision, url |
| Receiver | webhook_path |
| ImageRepository | image |
| ImagePolicy | source_name |
| ImageUpdateAutomation | source_name |
gotk_resource_info is an example of a metric used to collect information about
the Flux resources. This metric can be customized to add more labels, or more
such metrics can also be created by changing the kube-state-metrics custom
resource state configuration. Please see
Flux custom Prometheus
metrics for details about them.
Monitoring setup
In the
monitoring example repository, the monitoring configurations can be found in the
monitoring/
directory. monitoring/controllers/ directory contains the configurations for
deploying kube-prometheus-stack and loki-stack. We’ll discuss
kube-prometheus-stack below. For Flux log collection using Loki, refer to the
Flux logs docs.
The configuration in the monitoring/controllers/kube-prometheus-stack/
directory creates a HelmRepository of type OCI for the
prometheus-community
helm charts and a
HelmRelease to deploy the kube-prometheus-stack chart in the monitoring
namespace. This installs all the monitoring components in the monitoring
namespace. Please see the
values
used for the chart deployment and modify them accordingly.
The chart values used for configuring kube-state-metrics are in the file
kube-state-metrics-config.yaml,
as seen in the
kustomization.yaml,
which uses a kustomize ConfigMap generator to put the configurations in a
ConfigMap and use the chart values from the ConfigMap.
These values are merged with the inline chart values in the HelmRelease.
Kube-state-metrics values are in a separate file to make it easier to customize
the metrics it collects; refer to the
Flux custom Prometheus
metrics docs to see how they are used. Once
deployed with these values, the kube-state-metrics starts collecting and
exporting the Flux resource metrics.
To configure Prometheus to scrape Flux controller metrics, a
PodMonitor
is used that selects all the Flux controller Pods and sets the metrics endpoint
to the http-prom port. Once created, the prometheus-operator will
automatically configure Prometheus to scrape the Flux controller metrics.
Flux Grafana dashboards
The
example monitoring setup provides two example
Grafana dashboards in
monitoring/configs/dashboards
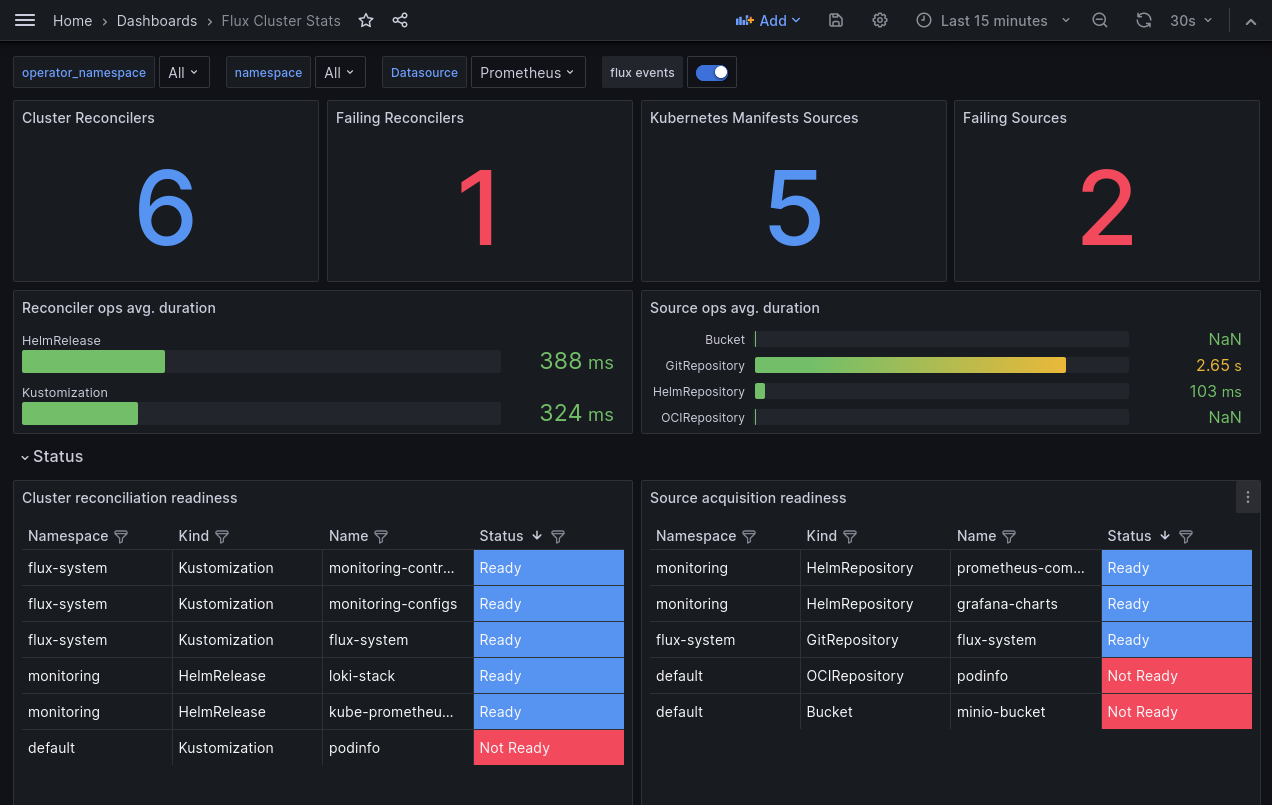
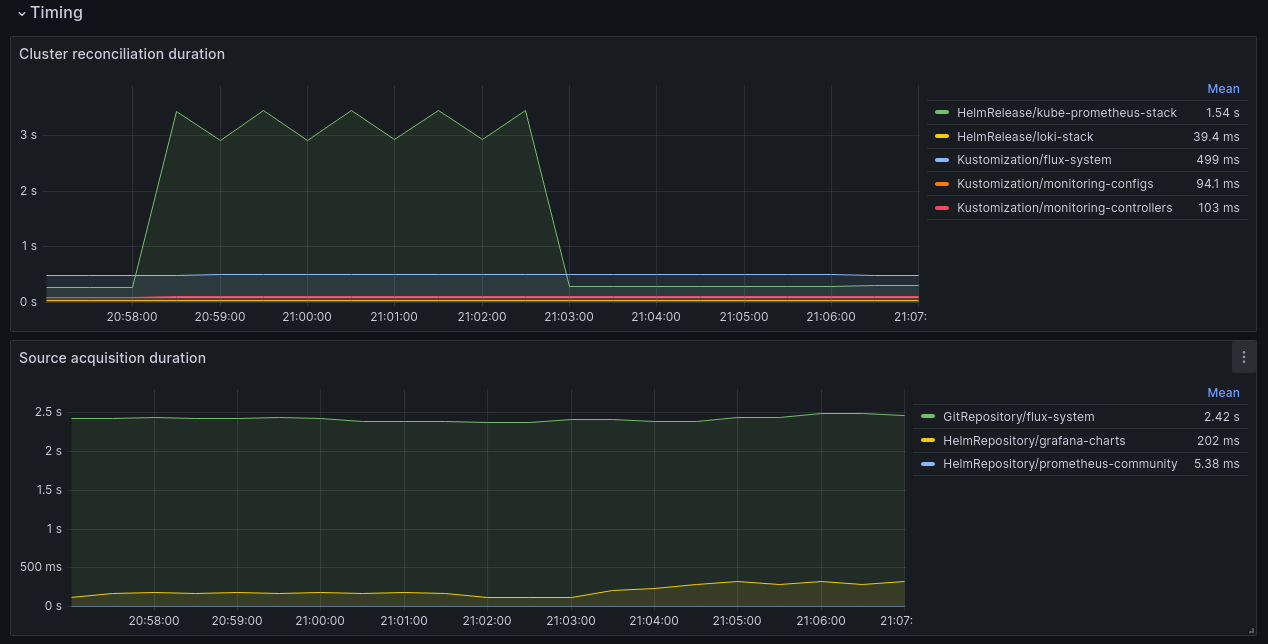
that use the Flux controller and resource metrics. The Flux Cluster Stats
dashboard shows the overall state of the Flux Sources and Cluster Reconcilers.
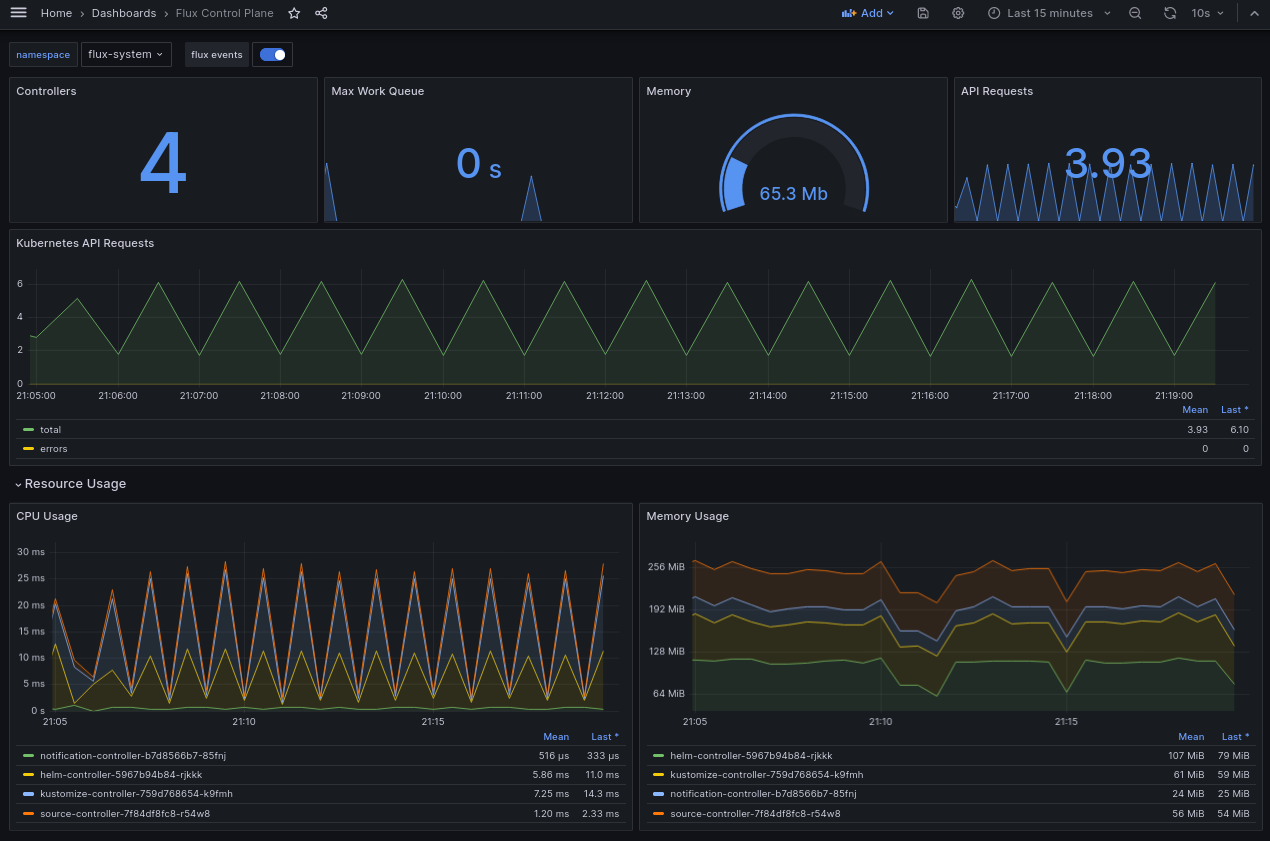
The Flux Control Plane dashboard shows the statistics of the various components
that constitute the Flux Control Plane and their operational metrics.
Control plane dashboard:
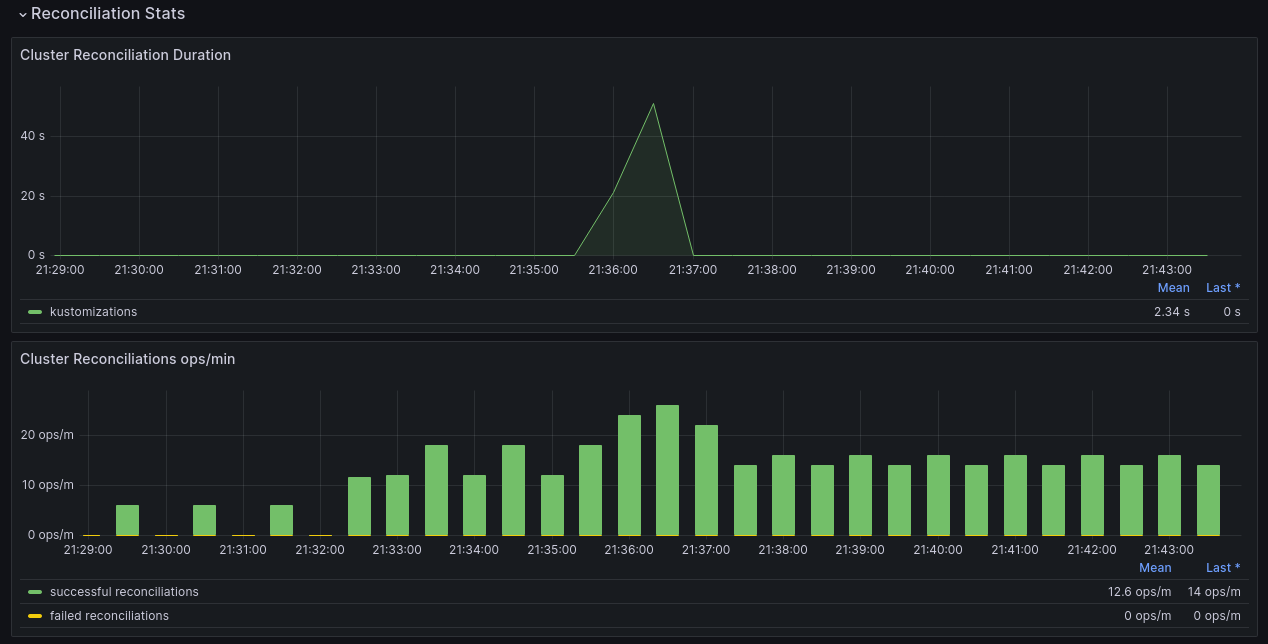
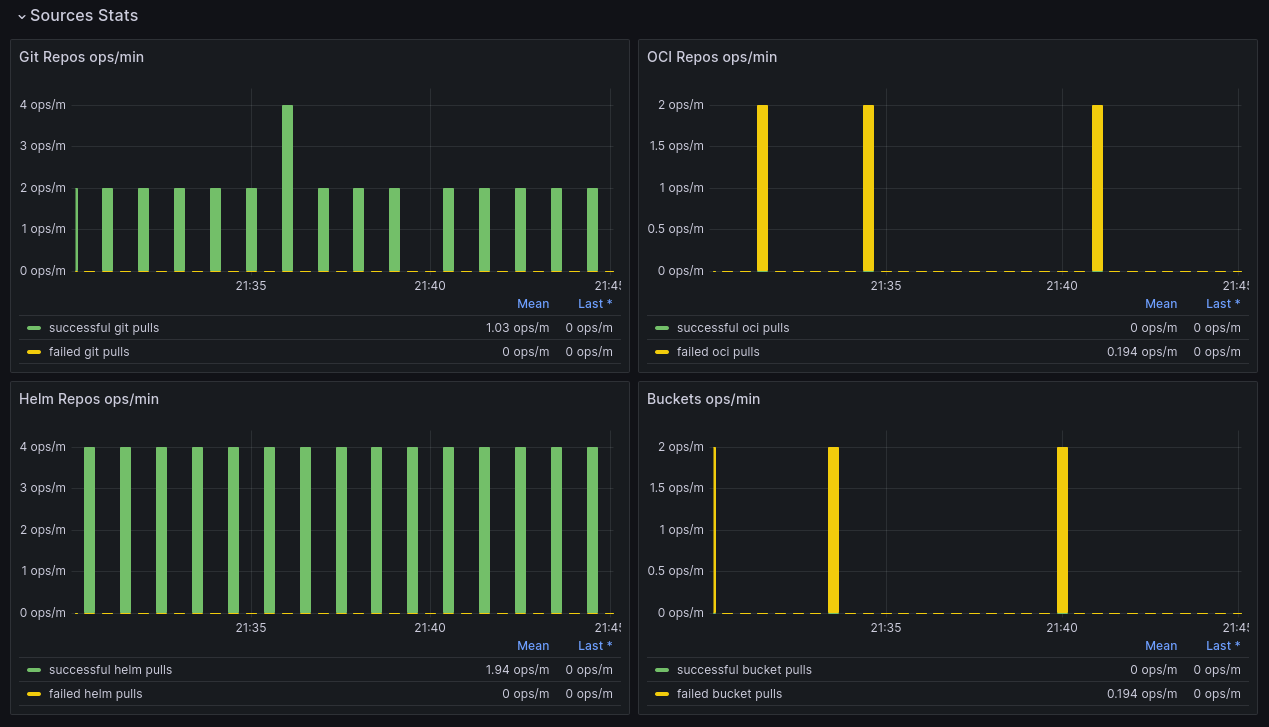
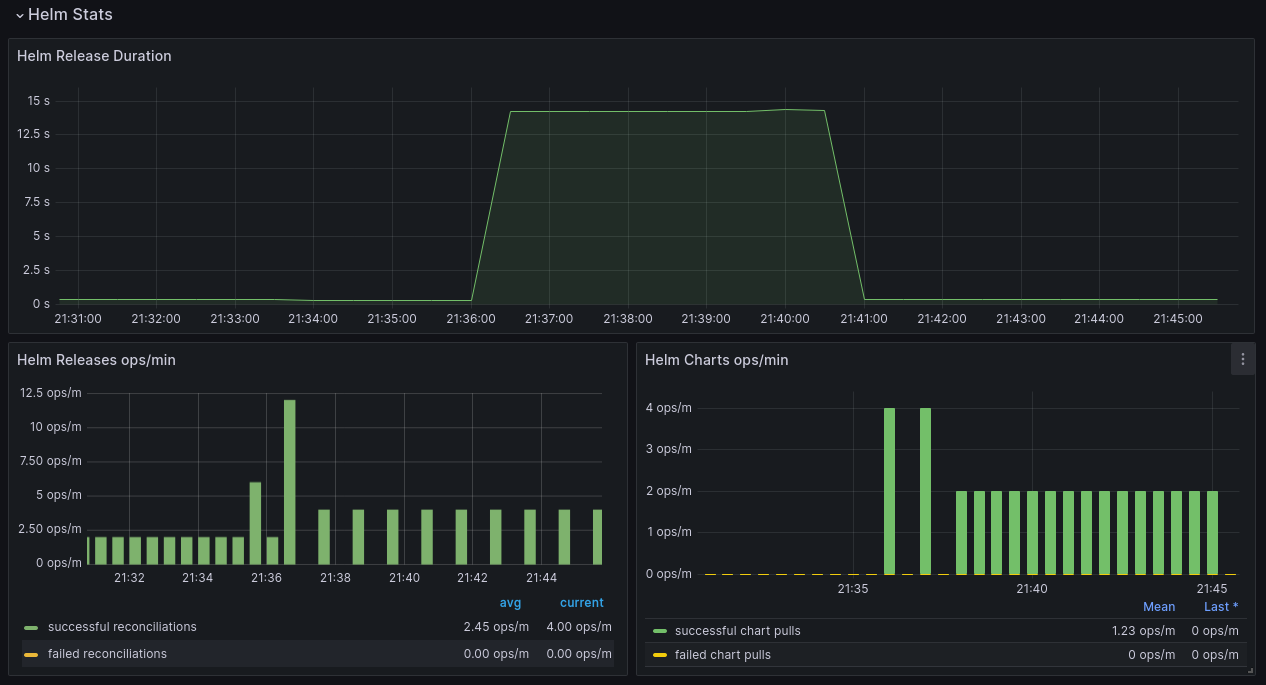
Cluster reconciliation dashboard:
More custom metrics can be created and used in the dashboards for monitoring Flux.