Traefik Canary Deployments
This guide shows you how to use the Traefik and Flagger to automate canary deployments.
Prerequisites
Flagger requires a Kubernetes cluster v1.16 or newer and Traefik v2.3 or newer.
Install Traefik with Helm v3:
helm repo add traefik https://helm.traefik.io/traefik
kubectl create ns traefik

cat <<EOF | helm upgrade -i traefik traefik/traefik --namespace traefik -f -
deployment:
  podAnnotations:
    prometheus.io/port: "9100"
    prometheus.io/scrape: "true"
    prometheus.io/path: "/metrics"
metrics:
  prometheus:
    entryPoint: metrics
EOF
Install Flagger and the Prometheus add-on in the same namespace as Traefik:
helm repo add flagger https://flagger.app

helm upgrade -i flagger flagger/flagger \
--namespace traefik \
--set prometheus.install=true \
--set meshProvider=traefik
Bootstrap
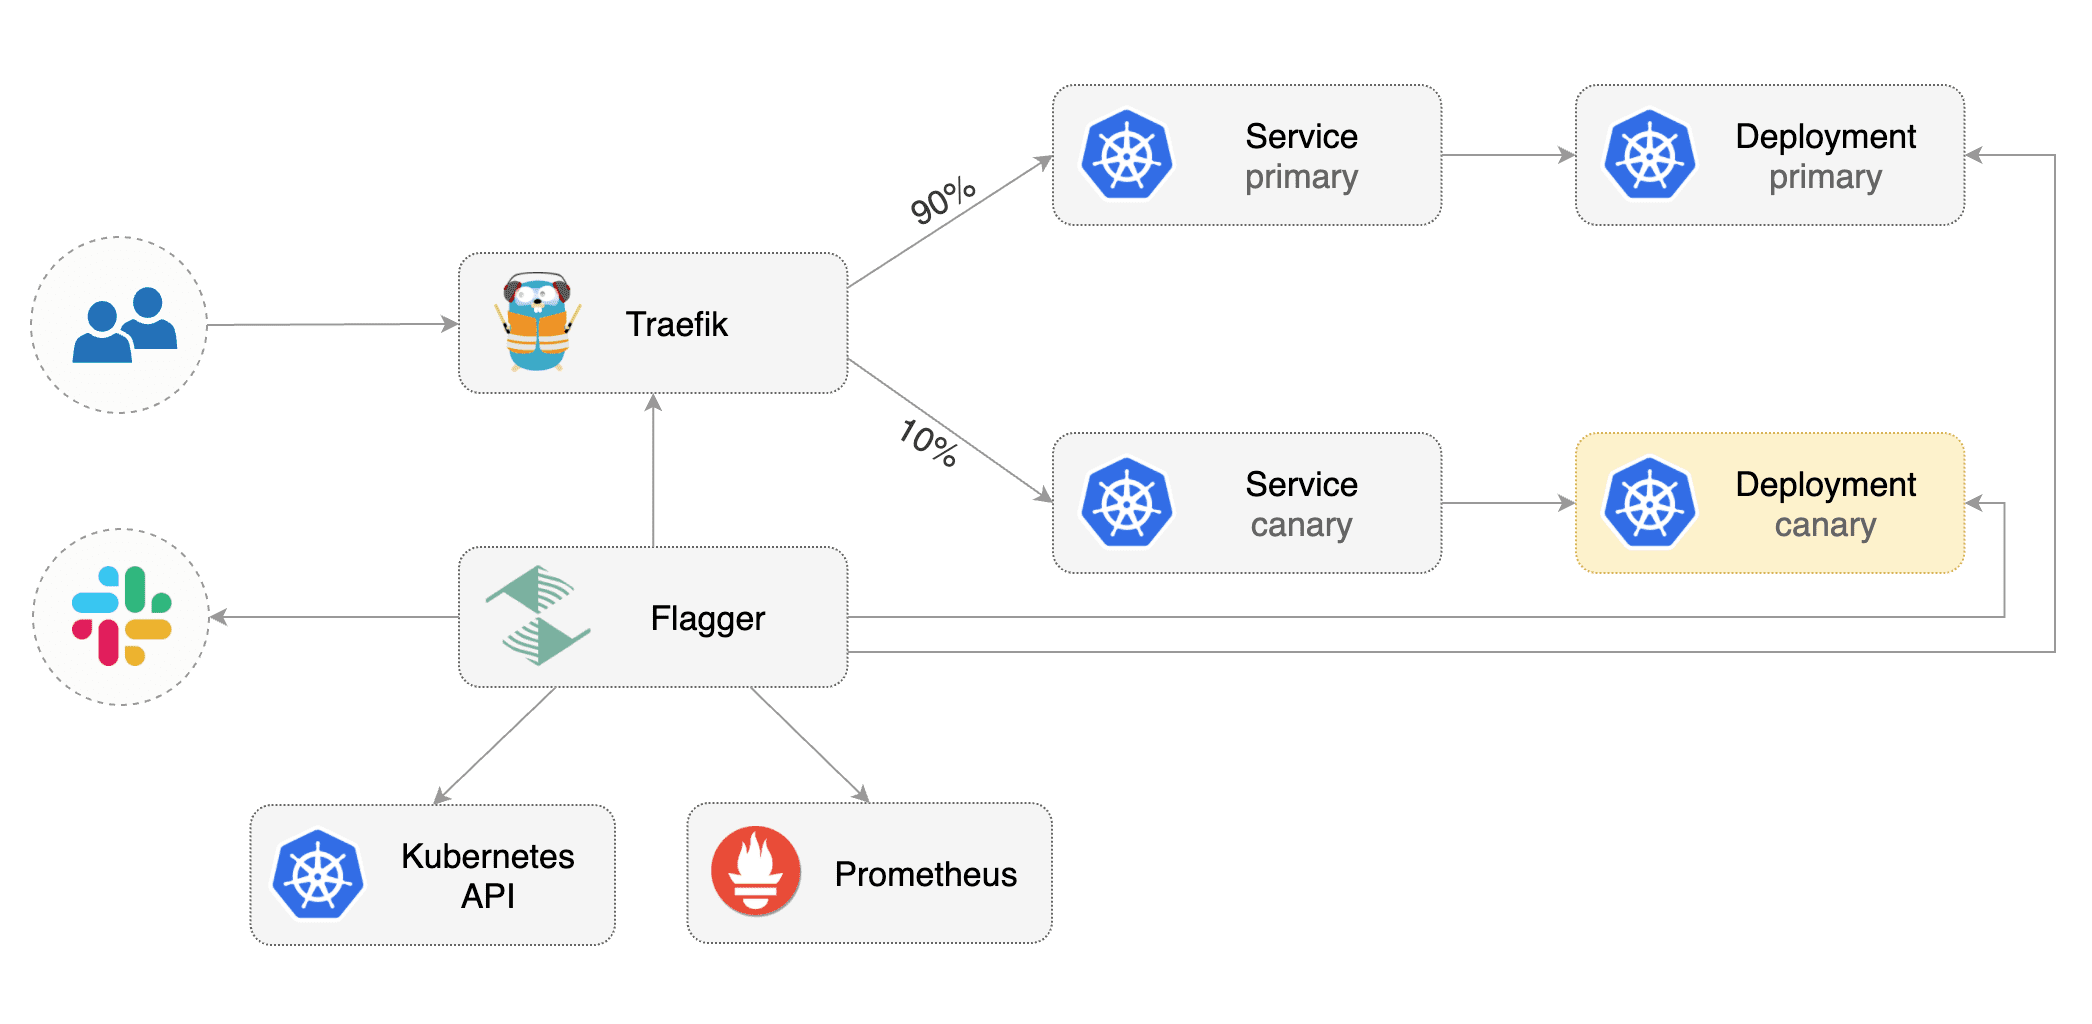
Flagger takes a Kubernetes deployment and optionally a horizontal pod autoscaler (HPA), then creates a series of objects (Kubernetes deployments, ClusterIP services and TraefikService). These objects expose the application outside the cluster and drive the canary analysis and promotion.
Create a test namespace:
kubectl create ns test
Create a deployment and a horizontal pod autoscaler:
kubectl apply -k https://github.com/fluxcd/flagger//kustomize/podinfo?ref=main
Deploy the load testing service to generate traffic during the canary analysis:
helm upgrade -i flagger-loadtester flagger/loadtester \
--namespace=test
Create Traefik IngressRoute that references TraefikService generated by Flagger (replace app.example.com with your own domain):
apiVersion: traefik.containo.us/v1alpha1
kind: IngressRoute
metadata:
  name: podinfo
  namespace: test
spec:
  entryPoints:
    - web
  routes:
    - match: Host(`app.example.com`)
      kind: Rule
      services:
        - name: podinfo
          kind: TraefikService
          port: 80
Save the above resource as podinfo-ingressroute.yaml and then apply it:
kubectl apply -f ./podinfo-ingressroute.yaml
Create a canary custom resource (replace app.example.com with your own domain):
apiVersion: flagger.app/v1beta1
kind: Canary
metadata:
  name: podinfo
  namespace: test
spec:
  provider: traefik
  # deployment reference
  targetRef:
    apiVersion: apps/v1
    kind: Deployment
    name: podinfo
  # HPA reference (optional)
  autoscalerRef:
    apiVersion: autoscaling/v2beta2
    kind: HorizontalPodAutoscaler
    name: podinfo
  # the maximum time in seconds for the canary deployment
  # to make progress before it is rollback (default 600s)
  progressDeadlineSeconds: 60
  service:
    # ClusterIP port number
    port: 80
    # container port number or name
    targetPort: 9898
  analysis:
    # schedule interval (default 60s)
    interval: 10s
    # max number of failed metric checks before rollback
    threshold: 10
    # max traffic percentage routed to canary
    # percentage (0-100)
    maxWeight: 50
    # canary increment step
    # percentage (0-100)
    stepWeight: 5
    # Traefik Prometheus checks
    metrics:
    - name: request-success-rate
      interval: 1m
      # minimum req success rate (non 5xx responses)
      # percentage (0-100)
      thresholdRange:
        min: 99
    - name: request-duration
      interval: 1m
      # maximum req duration P99
      # milliseconds
      thresholdRange:
        max: 500
    webhooks:
      - name: acceptance-test
        type: pre-rollout
        url: http://flagger-loadtester.test/
        timeout: 10s
        metadata:
          type: bash
          cmd: "curl -sd 'test' http://podinfo-canary.test/token | grep token"
      - name: load-test
        type: rollout
        url: http://flagger-loadtester.test/
        timeout: 5s
        metadata:
          type: cmd
          cmd: "hey -z 10m -q 10 -c 2 -host app.example.com http://traefik.traefik"
          logCmdOutput: "true"
Save the above resource as podinfo-canary.yaml and then apply it:
kubectl apply -f ./podinfo-canary.yaml
After a couple of seconds Flagger will create the canary objects:
# applied
deployment.apps/podinfo
horizontalpodautoscaler.autoscaling/podinfo
canary.flagger.app/podinfo

# generated
deployment.apps/podinfo-primary
horizontalpodautoscaler.autoscaling/podinfo-primary
service/podinfo
service/podinfo-canary
service/podinfo-primary
traefikservice.traefik.containo.us/podinfo
Automated canary promotion
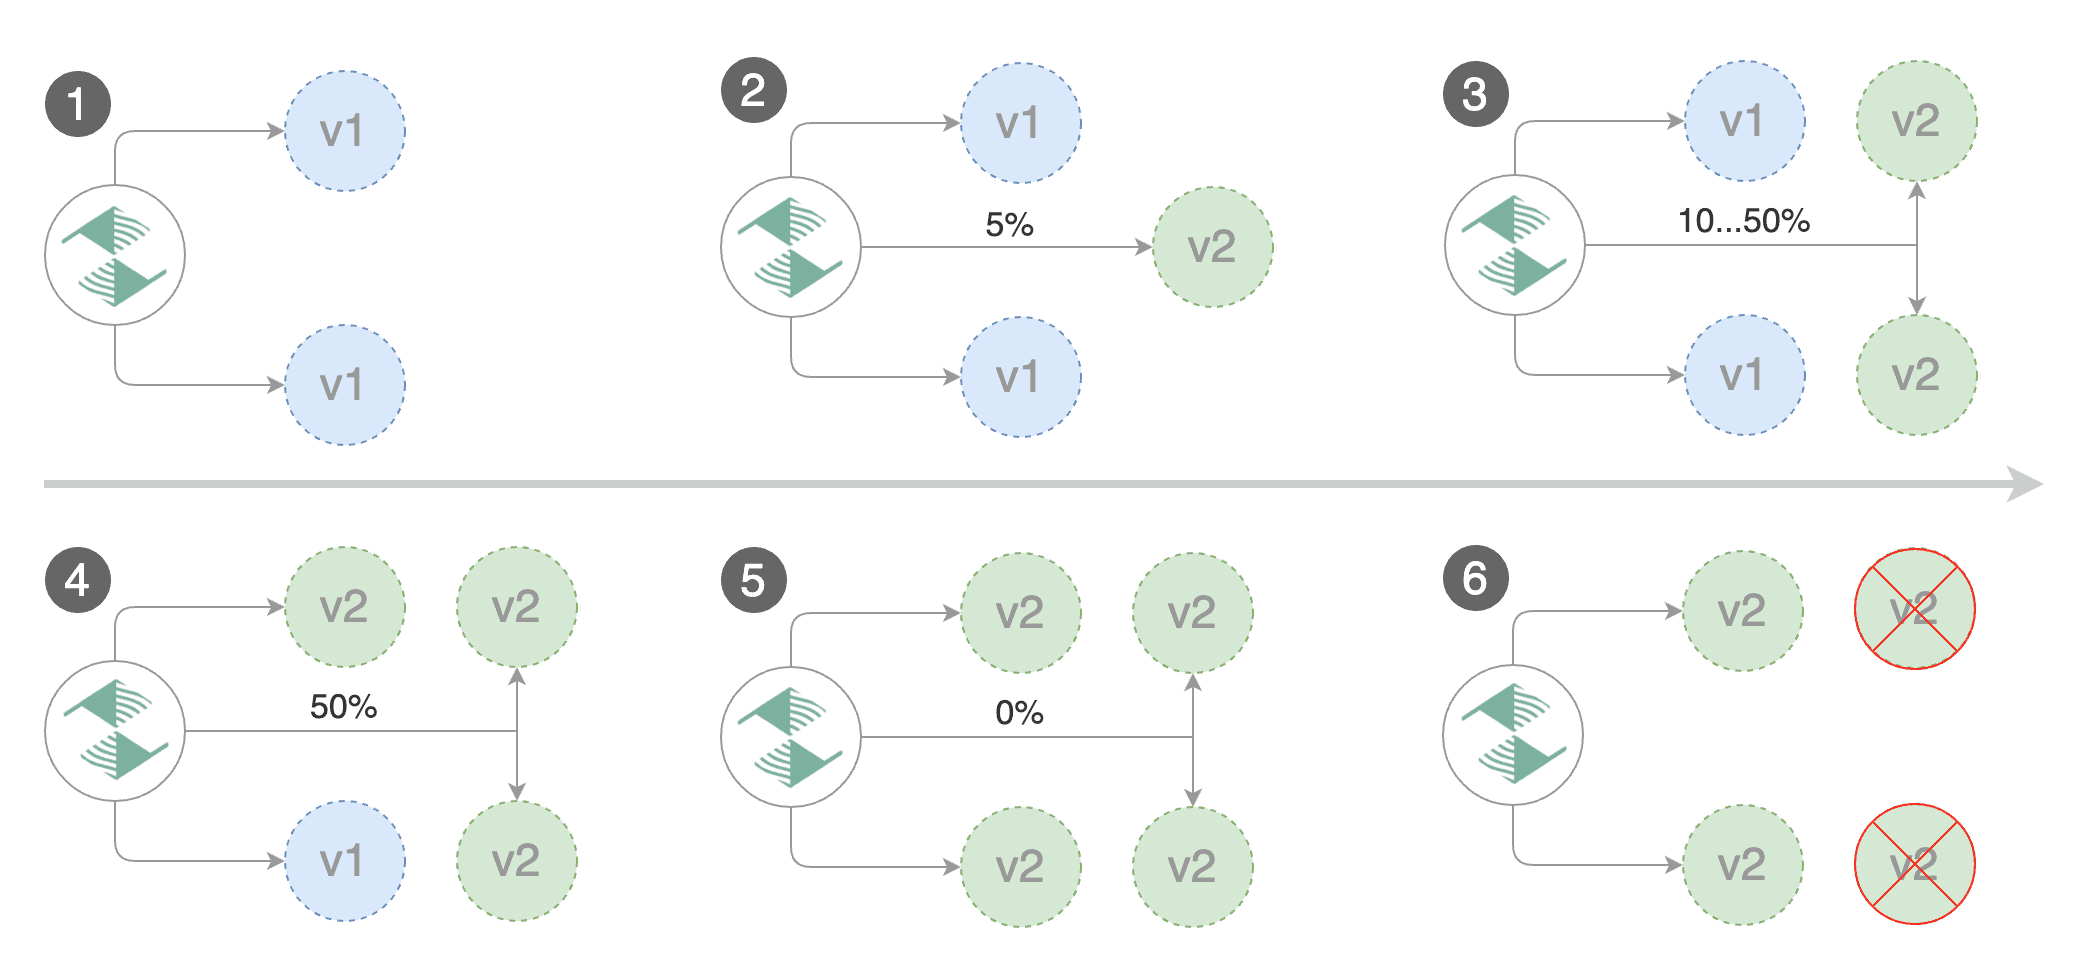
Flagger implements a control loop that gradually shifts traffic to the canary while measuring key performance indicators like HTTP requests success rate, requests average duration and pod health. Based on analysis of the KPIs a canary is promoted or aborted, and the analysis result is published to Slack or MS Teams.
Trigger a canary deployment by updating the container image:
kubectl -n test set image deployment/podinfo \
podinfod=stefanprodan/podinfo:4.0.6
Flagger detects that the deployment revision changed and starts a new rollout:
kubectl -n test describe canary/podinfo

Status:
  Canary Weight:         0
  Failed Checks:         0
  Phase:                 Succeeded
Events:
 New revision detected! Scaling up podinfo.test
 Waiting for podinfo.test rollout to finish: 0 of 1 updated replicas are available
 Pre-rollout check acceptance-test passed
 Advance podinfo.test canary weight 5
 Advance podinfo.test canary weight 10
 Advance podinfo.test canary weight 15
 Advance podinfo.test canary weight 20
 Advance podinfo.test canary weight 25
 Advance podinfo.test canary weight 30
 Advance podinfo.test canary weight 35
 Advance podinfo.test canary weight 40
 Advance podinfo.test canary weight 45
 Advance podinfo.test canary weight 50
 Copying podinfo.test template spec to podinfo-primary.test
 Waiting for podinfo-primary.test rollout to finish: 1 of 2 updated replicas are available
 Routing all traffic to primary
 Promotion completed! Scaling down podinfo.test
Note that if you apply new changes to the deployment during the canary analysis, Flagger will restart the analysis.
You can monitor all canaries with:
watch kubectl get canaries --all-namespaces

NAMESPACE   NAME        STATUS        WEIGHT   LASTTRANSITIONTIME
test        podinfo-2   Progressing   30       2020-08-14T12:32:12Z
test        podinfo     Succeeded     0        2020-08-14T11:23:88Z
Automated rollback
During the canary analysis you can generate HTTP 500 errors to test if Flagger pauses and rolls back the faulted version.
Trigger another canary deployment:
kubectl -n test set image deployment/podinfo \
podinfod=stefanprodan/podinfo:4.0.6
Exec into the load tester pod with:
kubectl -n test exec -it deploy/flagger-loadtester bash
Generate HTTP 500 errors:
hey -z 1m -c 5 -q 5 http://app.example.com/status/500
Generate latency:
watch -n 1 curl http://app.example.com/delay/1
When the number of failed checks reaches the canary analysis threshold, the traffic is routed back to the primary, the canary is scaled to zero and the rollout is marked as failed.
kubectl -n traefik logs deploy/flagger -f | jq .msg

New revision detected! Scaling up podinfo.test
Canary deployment podinfo.test not ready: waiting for rollout to finish: 0 of 1 updated replicas are available
Starting canary analysis for podinfo.test
Pre-rollout check acceptance-test passed
Advance podinfo.test canary weight 5
Advance podinfo.test canary weight 10
Advance podinfo.test canary weight 15
Advance podinfo.test canary weight 20
Halt podinfo.test advancement success rate 53.42% < 99%
Halt podinfo.test advancement success rate 53.19% < 99%
Halt podinfo.test advancement success rate 48.05% < 99%
Rolling back podinfo.test failed checks threshold reached 3
Canary failed! Scaling down podinfo.test
Custom metrics
The canary analysis can be extended with Prometheus queries.
Create a metric template and apply it on the cluster:
apiVersion: flagger.app/v1beta1
kind: MetricTemplate
metadata:
  name: not-found-percentage
  namespace: test
spec:
  provider:
    type: prometheus
    address: http://flagger-prometheus.traefik:9090
  query: |
    sum(
      rate(
        traefik_service_request_duration_seconds_bucket{
          service=~"{{ namespace }}-{{ target }}-canary-[0-9a-zA-Z-]+@kubernetescrd",
          code!="404",
        }[{{ interval }}]
      )
    )
    /
    sum(
      rate(
        traefik_service_request_duration_seconds_bucket{
          service=~"{{ namespace }}-{{ target }}-canary-[0-9a-zA-Z-]+@kubernetescrd",
        }[{{ interval }}]
      )
    ) * 100
Edit the canary analysis and add the not found error rate check:
  analysis:
    metrics:
      - name: "404s percentage"
        templateRef:
          name: not-found-percentage
        thresholdRange:
          max: 5
        interval: 1m
The above configuration validates the canary by checking if the HTTP 404 req/sec percentage is below 5 percent of the total traffic. If the 404s rate reaches the 5% threshold, then the canary fails.
Trigger a canary deployment by updating the container image:
kubectl -n test set image deployment/podinfo \
podinfod=stefanprodan/podinfo:4.0.6
Generate 404s:
watch curl http://app.example.com/status/400
Watch Flagger logs:
kubectl -n traefik logs deployment/flagger -f | jq .msg

Starting canary deployment for podinfo.test
Advance podinfo.test canary weight 5
Advance podinfo.test canary weight 10
Advance podinfo.test canary weight 15
Halt podinfo.test advancement 404s percentage 6.20 > 5
Halt podinfo.test advancement 404s percentage 6.45 > 5
Halt podinfo.test advancement 404s percentage 7.60 > 5
Halt podinfo.test advancement 404s percentage 8.69 > 5
Halt podinfo.test advancement 404s percentage 9.70 > 5
Rolling back podinfo.test failed checks threshold reached 5
Canary failed! Scaling down podinfo.test
If you have alerting configured, Flagger will send a notification with the reason why the canary failed.
For an in-depth look at the analysis process read the usage docs.