Flux logs
The Flux controllers follow the Kubernetes structured logging conventions. These logs can be collected and analyzed to monitor the operations of the controllers.
The fluxcd/flux2-monitoring-example repository provides a ready-made example setup to get started with monitoring Flux, which includes Loki-stack to collect logs from all the Flux controllers and explore them using Grafana. It is recommended to set up the monitoring example before continuing with this document to follow along. Before getting into Loki and Grafana setup, the following sections will describe the Flux logs and how to interpret them.
Controller logs
The default installation of Flux controllers write logs to stderr in JSON
format at the info log level. This can be configured using the
--log-encoding and --log-level flags in the controllers. Refer to the
flux-system
kustomization
for an example of how to patch the Flux controllers with flags. The following
example patch snippet can be appended to the existing set of patches to add a
log level flag and change the log level of the controller to debug.
- op: add
  path: /spec/template/spec/containers/0/args/-
  value: --log-level="debug"
Structured logging
The Flux controllers support structured logging with the following common labels:
levelcan bedebug,infoorerrortstimestamp in the ISO 8601 formatmsginfo or error descriptionerrorerror details (present whenleveliserror)controllerGroupthe Flux CR groupcontrollerKindthe Flux CR kindnameThe Flux CR namenamespaceThe Flux CR namespacereconcileIDthe UID of the Flux reconcile operation
Sample of an info log produced by kustomize-controller:
{
  "level": "info",
  "ts": "2023-08-16T09:36:41.286Z",
  "controllerGroup": "kustomize.toolkit.fluxcd.io",
  "controllerKind": "Kustomization",
  "name": "redis",
  "namespace": "apps",
  "msg": "server-side apply completed",
  "revision": "main@sha1:30081ad7170fb8168536768fe399493dd43160d7",
  "output": {
    "ConfigMap/apps/redis": "created",
    "Deployment/apps/redis": "configured",
    "HorizontalPodAutoscaler/apps/redis": "deleted",
    "Service/apps/redis": "unchanged",
    "Secret/apps/redis": "skipped"
  }
}
Sample of an error log produced by kustomize-controller:
{
  "level": "error",
  "ts": "2023-08-16T09:36:41.286Z",
  "controllerGroup": "kustomize.toolkit.fluxcd.io",
  "controllerKind": "Kustomization",
  "name": "redis",
  "namespace": "apps",
  "msg": "Reconciliation failed after 2s, next try in 5m0s",
  "revision": "main@sha1:f68c334e0f5fae791d1e47dbcabed256f4f89e68",
  "error": "Service/apps/redis dry-run failed, reason: Invalid, error: Service redis is invalid: spec.type: Unsupported value: Ingress"
}
The log labels shown above can be used to query for specific types of logs. For
example, error logs can be queried using the error label, the output of
successful reconciliation of Kustomization can be queried using the output
label, the logs about a specific controller can be queried using the
controllerKind label.
Querying logs associated with resources
For querying logs associated with particular resources, the flux logs CLI
command can be used. It connects to the cluster, fetches the relevant Flux logs,
and filters them based on the query request. For example, to list the logs
associated with Kustomization monitoring-configs:
$ flux logs --kind=Kustomization --name=monitoring-configs --namespace=flux-system --since=1m
...
2023-08-22T18:35:45.292Z info Kustomization/monitoring-configs.flux-system - All dependencies are ready, proceeding with reconciliation
2023-08-22T18:35:45.348Z info Kustomization/monitoring-configs.flux-system - server-side apply completed
2023-08-22T18:35:45.380Z info Kustomization/monitoring-configs.flux-system - Reconciliation finished in 88.208385ms, next run in 1h0m0s
Refer to the
flux logs CLI docs to learn more about
it.
Log aggregation with Grafana Loki
In the
monitoring example repository, the monitoring
configurations can be found in the
monitoring/
directory. monitoring/controllers/ directory contains the configurations for
deploying kube-prometheus-stack and loki-stack. We’ll discuss loki-stack below.
For Flux metrics collection using Prometheus, refer to the
Flux Prometheus
metrics docs.
The configuration in the
monitoring/controllers/loki-stack
directory creates a HelmRepository for the
Grafana
helm-charts and a HelmRelease to
deploy the loki-stack chart in the monitoring namespace. Please see the
values
used for the chart and modify them accordingly.
Once deployed, Loki and Promtail Pods get created, and Loki is added as a data source in Grafana. Promtail aggregates the logs from all the Pods in every node and sends them to Loki. Grafana can be used to query the logs from Loki and analyze them. Refer to the LogQL docs to see examples of queries and learn more about querying logs.
Grafana dashboard
The
example monitoring setup provides a Grafana
dashboard in
monitoring/configs/dashboards/logs.json
that queries and shows logs from all the Flux controllers.
Control plane logs:
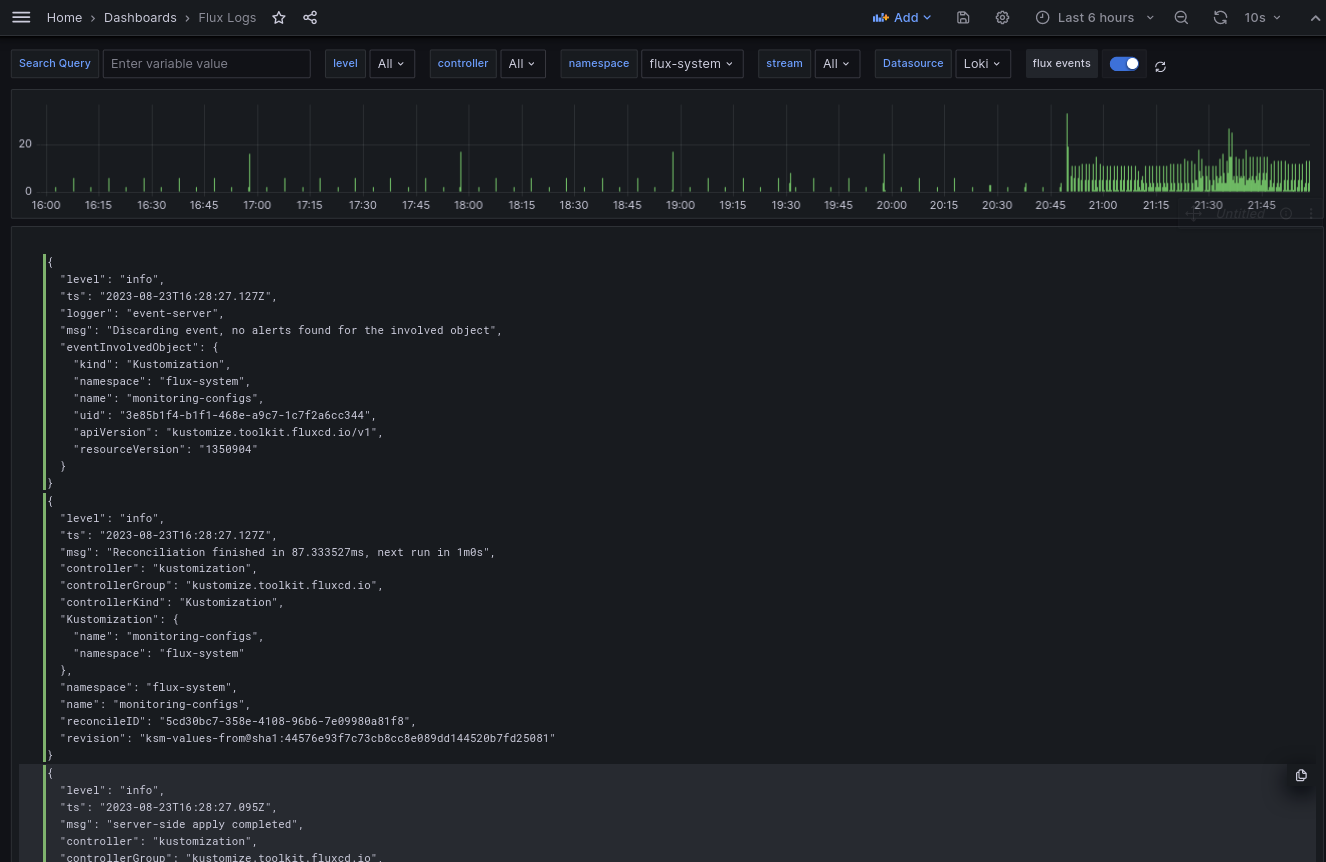
This can be used to browse logs from all the Flux controllers in a centralized manner.